Uptime Robo Powered by GlobalSolutions
Uptime Robo

Powered by GS
Configuration :Make sure to attach an elastic IP to your instance.
We made all the configuration for you, but you still have to make some configuration changes to integrate with your services.
Configuration to monitor your service:
The first configuration will be to add the target or service that you want to monitor.
SSH to your instance. From the home directory which is the default landing directory go to ~/gs/prometheus. Open the file prometheus.yml
In our example, we have given the target as “https://theglobalsolutions.net”. Replace this target url with the service you want to monitor. You can also add multiple targets in each line following the same format as shown below,
- job_name: UpTime-Robo
metrics_path: /probe
params:
module: [http_2xx]
static_configs:
- targets:
- https://theglobalsolutions.net
- https://gooogle.com
- https://yahoooooo.com
Save the file and restart the prometheus service using the following command”
systemctl restart prometheus.service
Once the Prometheus is restarted, browse your elasticIP with port 3000 like the following.
http://your-elastic-IP:3000. Enter the username as
admin and password as
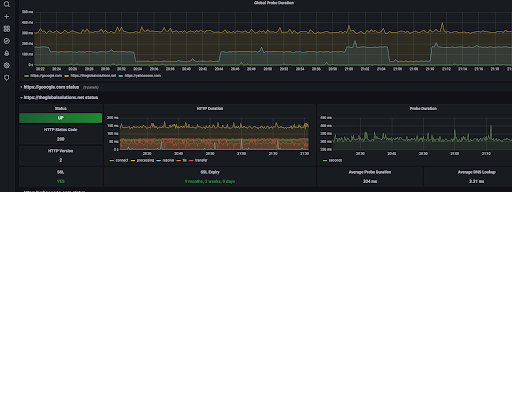
admin. The application will request you to change the password and please make the required changes. Once done go to “Manage” on the left menu and open the UPTime Metrics dashboard. You will be able to see your service uptime below.
 Configure your Email for alerting:
-
receivers:
Configure your Email for alerting:
-
receivers:
- name: 'uptime-team'
email_configs:
- to: 'Your email address where alert needs to be send'
Configure your Slack with alerts notification:
Create a channel in your slack, we have created a channel called “uptime” and have referred to it in this example. You can create a channel name of your choice
We need to configure the slack API url and channel name in the alertmanager.yml file. Follow the below steps to add this configuration.
Go to Slack -> Administration -> Manage apps
In the Manage apps directory, search for Incoming WebHooks and add it to your Slack workspace.
After you confirm and add Incoming WebHooks integration, webhook URL (which is your Slack API URL) is displayed. Copy it as we need to add them in the alert manager.
Go to home and open the alertmanager.yml file located in the gs/alertmanager. In this file add the webhook url in the global section. Replace the one that is in the file with your url, below is a snippet from yml file for reference.
global:
slack_api_url: 'https://hooks.slack.com/services/T0QCDCLF/B027P/0rq19Qdwix2Ew'
The last step in this config is to add the channel name that you created in the first step under slack configurations.
slack_configs:
- channel: 'uptime'
Integrating with your PagerDuty Account:
We are going to assume that you are already familiar with the pager duty, escalation policy and that you have all these configured. In this document, we are going to show you how to integrate with existing PagerDuty.
Login into your PagerDuty account and go to “new service” in pagerduty. Add a service by giving a name and adding all the default values. You will get to a point to add integrated services and pick prometheus at this point. Once you complete you will get a Key and a few other attributes, our interest is only in the keys. Take those keys and replace it with the PagerDuty config in the receiver section of the alertmanager.yml file.
If you need to customize more and need more information please contact us at
support@theglobalsolutions.net

