
Apache Web Server with Prometheus Monitoring
Powered by GlobalSolutions
Powered by GlobalSolutions

Apache is the most widely used web server software. It is fast, reliable, secure, and can be highly customized to meet the needs of many different environments by using extensions and modules. We are providing a customized version by integrating with Prometheus monitoring. This helps you to seamlessly monitor the Apache webserver as you use in your production environment.
Learn MoreAs soon as you launch the instance you will start seeing the metrics. We have built a decent set of metrics which will help you to start monitoring the Apache Webserver right away. Click on any of the links in the Grafana or Prometheus section to see a sample dashboard. You will be able to add more metrics to the same dashboard and tweak any of the parameters to customize to your needs
You can view the sample metrics through the links available in the Grafana and Prometheus sections
Login with the user admin and password admin. You will be requested to change your password at this time.
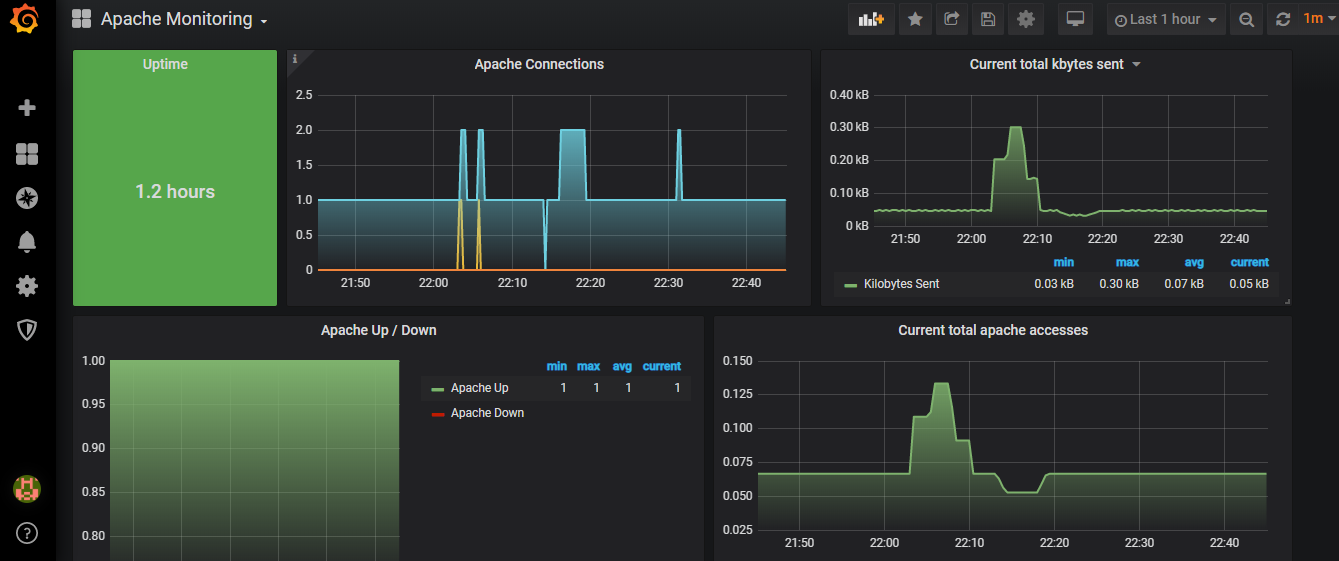
Go to Manage dashboard on the left and select Apache Monitoring Dashboard. You will see a good set of metrics that can help manage and monitor your Apache Webserver.
There is no login required for Prometheus. Use the following link http://elasticIP:9090 to broswe see all the metrics. You either use the console are graph to view. You can run any custom query to see the metrics.


